Supply Chain Optimization: How Contextual Data Visualization Results In Better Business Decisions
Contextual Data Visualization Helps You Make Better Supply Chain Decisions
When looking at optimizing a supply chain, data has to be an asset that helps you make informed decisions. Today’s technology provides us endless amounts of data from all levels of the supply chain. Warehouse Management Systems and Transportation Management Systems amass millions of data points around inventory, location, frequency of shipments, etc. Compiling and tracking supply chain data is crucial to managing, forecasting and making decisions about your business.
But what do you do with all that data?
When it comes to interpreting data and turning it into information that helps supply chains become optimized and efficient, it’s crucial to be able to see your data in the correct context—and that’s where data visualization comes in.
Level 1 — How Data Starts
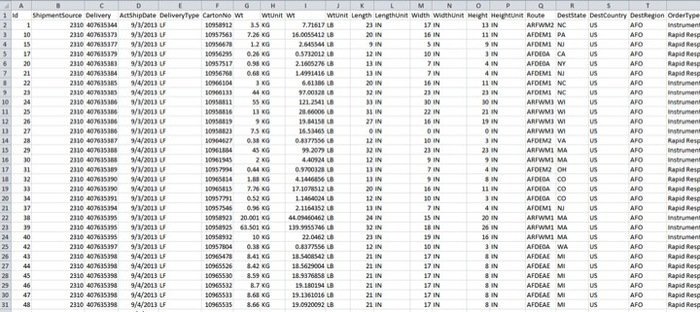
This is generally how data starts—the spreadsheet. Although we’re big fans of the spreadsheet, they are typically filled with more information than most can find useful. Columns and rows of data can only tell you so much, they usually do not provide the context in which truly educated business decisions can be made. Spreadsheet masters can isolate the important columns, sort by a certain range, and show you a slightly less overwhelming view, but it’s still difficult to interpret data in this format. And even if one person on your team can interpret the data, they still may be unable to demonstrate its meaning to customers and key stakeholders.
Level 2 — Basic Data Visualization
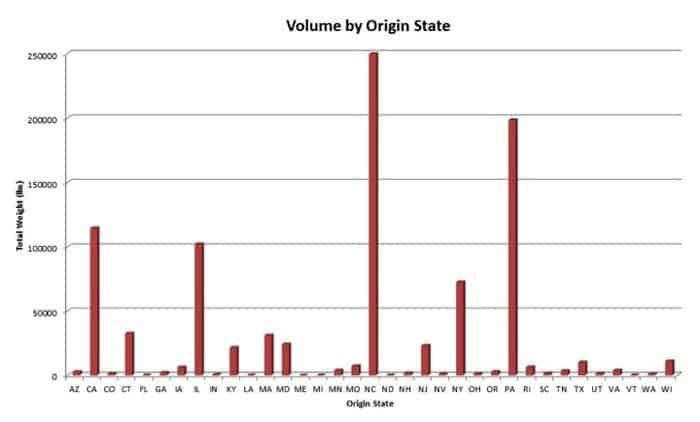
This next level is as far as many will go in visualizing their data. A few clicks can make a bar or pie chart out of a spreadsheet, showing data spread across selected parameters. However, in many supply chain management contexts, this type of visualization doesn’t necessarily illustrate the true meaning of how these data points are correlated – or what the data is saying about the business.
The fact that these data points are from states isn’t informing the way that the data is being presented —it’s being presented the same as if they were data points from alphabetical warehouses, or from packages tracked each month over a year. Treating a table or graph depiction of data without any context does not help clarify the data for decision makers. To be able to drive efficiency and supply chain optimization calls for a better approach.
Let LEGACY SCS Help You Visualize Opportunities in Your Supply Chain >
Level 3 — Contextual Data Visualization
The obvious approach in supply chain is to put things on a map. Although that may sound simple, let’s look at how powerful this type of data becomes when placed into the proper supply chain context:
1. Least Cost Sourcing from a network of US distribution centers:
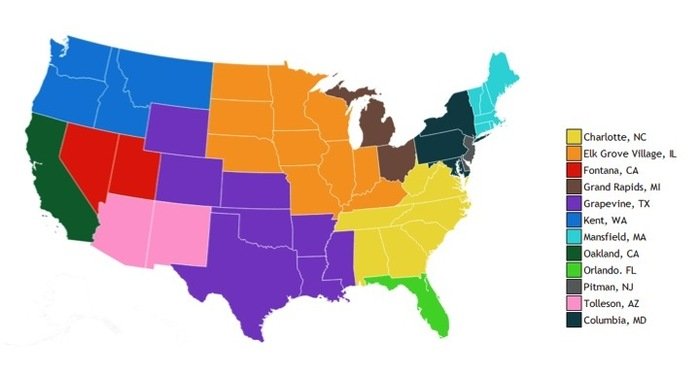
This type of visual can be a logistics managers dream. This least cost sourcing map takes distribution center locations and incorporates SKU dimensional data, inventory stock levels, shipping mode weight break levels, freight class cost rating, service time requirements and state population density data. The result – a logistics manager can quickly decide which distribution center product should be sourced from to minimize transportation costs and meet or exceed service level requirements when shipping into any given state.
2. Airfreight Transportation Route Mapping:
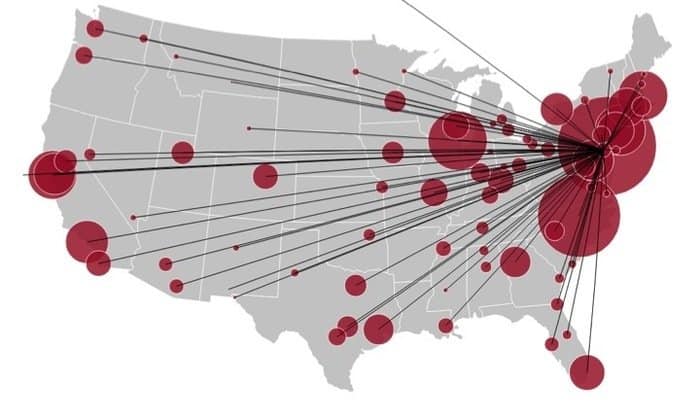
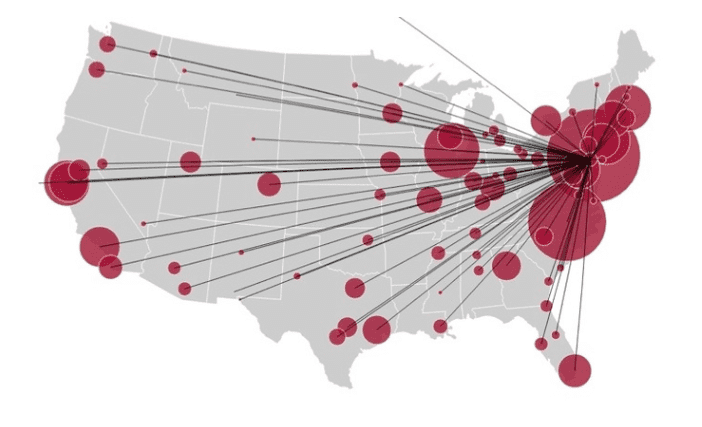
This second example depicts air freight density from a given distribution facility location. The data involved looks at volume by destination, service level requirement, and cost factors.
3. Service/Transport Mode Optimization:
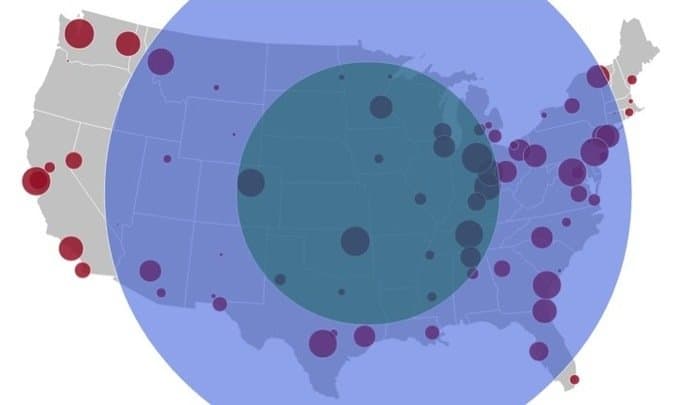
Deciding which transport mode to ship on is something that often falls into the category of “well, that’s how we’ve always done it…” — which is a category that provides plenty of opportunity for continual improvement. However, utilizing existing supply chain data can provide insight into daily opportunities to optimize transportation spend. In this case, we looked at sample airfreight shipment data from a Midwest distribution center, and brought in data points such as LTL cost, LTL service level, freight class rating and destination shipping density. The resulting map illustrates the opportunity to shift costly airfreight expense over to much more economical LTL- while maintaining the same service level! This type of insight can easily shave thousands of dollars off of logistics freight spend.
4. Facility Location Feasibility:
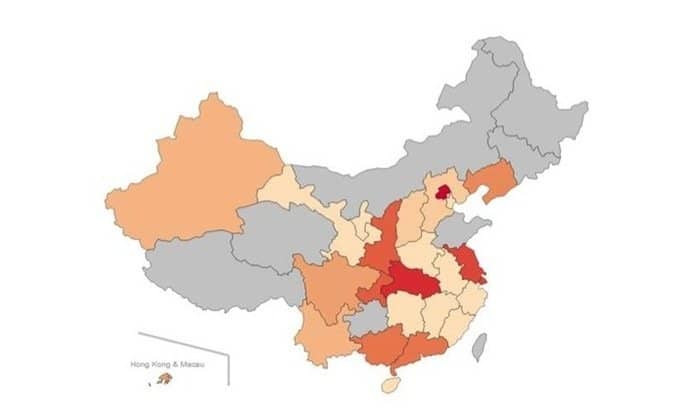
The last map is an example of how origin freight volume data can be used to make decisions on optimal facility location. In this case, the map depicts how an international shipper or 3PL would consider locating a foreign office, based on origin freight volumes. The same logic could also be applied when deciding how to best set up a distribution center network, or align transportation resources to meet customer shipping demands.
It’s easy to see why contextual data visualization provides insight to help business leaders make decisions that ultimately make supply chain a competitive advantage rather than just a cost center.
Making decisions requires more than just data. It requires information – which only comes when data is analyzed and presented with contextual intelligence.
Having this tool allows you to move to the next level of supply chain visibility – taking data, no matter how complex, and presenting it in a way that allows real decision making. Although supply chain in its most basic form is still putting a box on a truck and getting it from point A to point B – supply chain optimization is where value is realized.
A dedicated 3PL partner with supply chain engineering expertise and the know-how to proactively use data is an asset to your business. Any 3PL can generate a spreadsheet or give you a link to online tracking. Ask yourself “is your 3PL provider proactively helping you visualize opportunities in your supply chain?”
-
Legacy Achieves Platinum Status for Delivery Excellence From Amazon
When it comes to supply chain performance, the margin for error is razor thin. Customers expect orders to arrive quickly, accurately, and...
+ Read more -
IPS Corporation selects Legacy as 3PL Partner to drive Supply Chain Transformation
FRANKLIN, IN | September 10th, 2025 – Legacy SCS announced that it has been selected by IPS Corporation, a global leader in Water...
+ Read more -
How GForce Transformed Its Supply Chain Into a Powerful Growth Engine
When GForce Arms launched in 2020, the mission was simple but ambitious: deliver affordable, reliable firearms with the speed and...
+ Read more
